Last week’s #FridayFun gets delayed a few days due to […checks notes] a localised Paging Lockout. Apologies for the disruption.
Quick one this week, but I think it’s a good one. I presume most people who’ve found themselves debugging SIP signaling on a fpbx system are familiar with sngrep. If you’re only familiar with wireshark, then run (don’t walk) to google and find yourself a tutorial. At some point I will have to do a rewrite of my own sngrep walkthrough for TangoPBX, and when I do I’ll include this info.
The major problem with sngrep (or any pcap viewer such as wireshark), is the (extreme?) difficulty of viewing SIP signaling for encrypted devices. Luckily after you’ve gone through the effort of getting yourself a proper certificate, setting up Asterisk for TLS signaling and getting your devices registered using PJSIP with an encrypted transport, the hard part is over. You can use asterisk to save pcaps directly.
I’m starting with Asterisk 20.14.1, but I’m sure any reasonably recent supported version will have this feature. On my home prod system, I have extension 3106 registered using TLS:
pbx*CLI> pjsip show contact 3106/sip:3106@173.xx.yy.100:58394;transport=TLS;x-ast-orig-host=192.168.98.162:58394
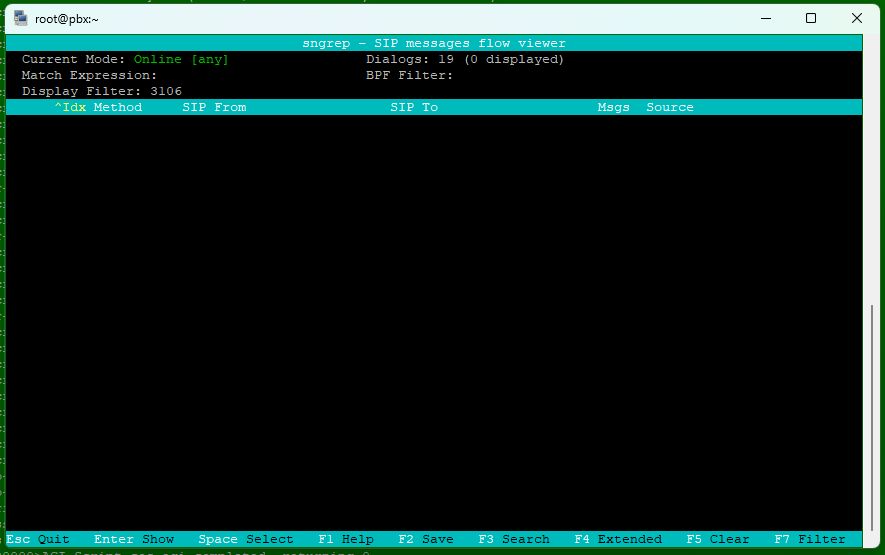
If I launch sngrep so I’m watching traffic live on the system and F3 filter for 3106, I will see nothing at all showing up for SIP dialogs
But if I go to the Asterisk console and issue the following commands, I can have Asterisk save all the SIP activity to a pcap file:
pbx*CLI> pjsip set logger on
PJSIP Logging enabled
pbx*CLI> pjsip set logger pcap /tmp/speakingclock.pcap
PJSIP logging to pcap file '/tmp/speakingclock.pcap'
Now I make a call from 3106, in this case to the *60 feature code for speaking clock. Watching the asterisk console, I see the SIP messages as well as the standard Asterisk console logging zip by. For this example, here is part of the console output:
<--- Received SIP request (1250 bytes) from TLS:173.xx.yy.100:58394 --->
INVITE sip:*60@pbx.redacted.ca:50612 SIP/2.0
Via: SIP/2.0/TLS 192.168.98.162:58394;branch=z9hG4bKd4f9991f
From: "3106" <sip:3106@pbx.redacted.ca:50612>;tag=8268f69c820d4f6;epid=DP30bb53
To: <sip:*60@pbx.recacted.ca:50612>
Call-ID: 20b18a28bf8da90@192.168.98.162
     *** snip ***

<--- Transmitting SIP response (344 bytes) to TLS:173.xx.yy.100:58394 --->
SIP/2.0 100 Trying
Via: SIP/2.0/TLS 192.168.98.162:58394;rport=58394;received=173.xx.yy.100;branch=z9hG4bKd4f9991f
Call-ID: 20b18a28bf8da90@192.168.98.162
   *** snip ***

    -- Executing [*60@from-internal:1] Set("PJSIP/3106-00000001", "__COS_DEST=speakingclock") in new stack
   *** snip ***
Even on a lightly loaded system with no calls, there’s enough background SIP OPTIONS and REGISTER activity to make debugging SIP via the console difficult. But we now have the logger activity logged to a file named /tmp/speakingclock.pcap. Lets stop the logger, exit the asterisk console to bash, and view the file with sngrep:
pbx*CLI> pjsip set logger off
PJSIP Logging disabled
pbx*CLI>
Disconnected from Asterisk server
Asterisk cleanly ending (0).
Executing last minute cleanups
[root@pbx ~]# sngrep -I /tmp/speakingclock.pcap
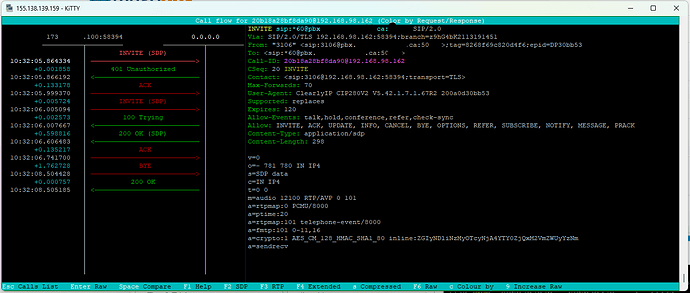
Now, when we press F3 to do a filter for 3106, we see all the activity from asterisk while the logger was enabled. Then browsing to the INVITE for *60, we can see the ladder with all the signaling in one place
We can see that the raw SIP messaging from the Asterisk console that shows the Call-ID
Call-ID: 20b18a28bf8da90@192.168.98.162
and see that it matches the SIP dialog showing in sngrep.
There are limitations with this method. Most importantly there is no media in the pcap, which makes it ideal to vew in sngrep as it also ignores media. But if you’re debuggging rtp/audio issues, then this will only get you started. Asterisk translates the TLS into UDP packets for the pcap, so be aware that the pcap is an approximation of what’s happening at the network level. Also it appears that you must close the file before you can view it in sngrep.
The limitations notwithstanding, this is by far the easiest way of viewing and debugging TLS signaling that I’ve encountered. It’s not quite live, but only a few keystrokes away from it.
That’s all for this week, have a good one!

